Harvey, Irma, and Maria's Impact on the Alternative Capital Market

Aaron Koch | November 15, 2017

Introduction
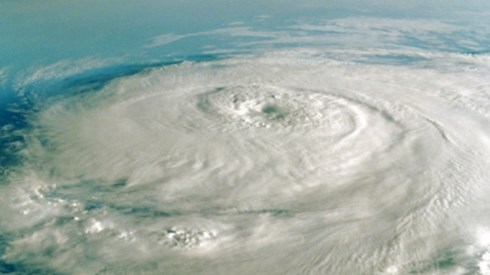
The United States' long national major hurricane drought is over. Over the course of 4 weeks late in the summer of 2017, Hurricanes Harvey, Irma, and Maria (or "HIM") brought dangerous and immensely destructive conditions to a wide swath of the Caribbean and continental United States. Although not yet over, it is already clear that 2017 will join 1950, 2004, and 2005 as one of the most consequential North Atlantic hurricane seasons on record.
These storms will lead to reconstruction and rebuilding efforts on an unprecedented scale. The property and casualty insurance and reinsurance markets are positioned to step in and provide perhaps the largest series of storm-related payouts in history. In addition, for the first time certain financial investors will contribute to insurance payouts as well, as providers of alternative capital to the reinsurance markets.
For many participants in the alternative capital market—or equivalently, the insurance-linked securities (ILS) market—2017 will represent the first major test of their risk selection and operational capabilities. Alternative capital has grown eightfold since the historic 2005 hurricane season. As a result, it has often faced questions as to how it would perform in the face of a major event. Will investors pay claims with the same reliability as traditional reinsurers? Would they flee after losing money or remain committed to the market? Following HIM, alternative capital has an opportunity to prove its value and staying power.
As the dust begins to settle and loss evaluation begins, the alternative capital market faces several key questions, including the following.
- What types of alternative capital instruments are most likely to be impacted?
- How long will it take to have an accurate estimate of losses to alternative capital funds?
- What are the expected impacts on locked collateral heading toward January 1 renewals?
- Will this season finally lead to the hardening of market prices?
After brief event synopses, we will review each of these questions in turn.
Event Synopses
Harvey
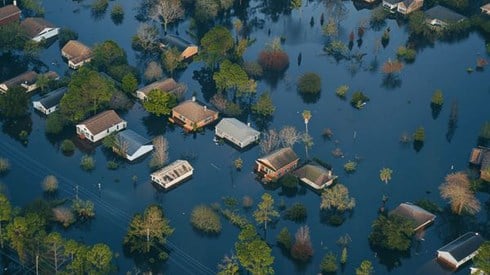
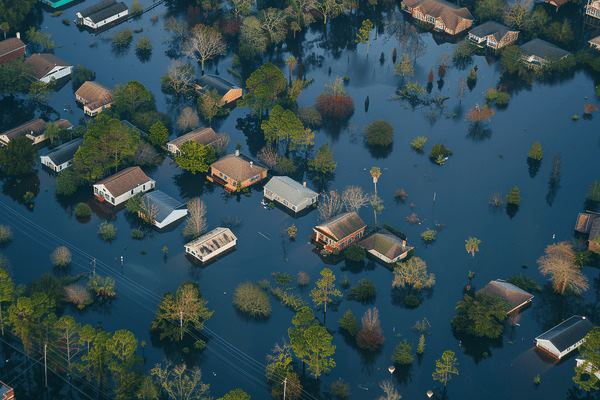
Hurricane Harvey was an atypical hurricane in a number of ways. After a benign initial landfall in Mexico, Harvey reemerged in the Gulf of Mexico and rapidly strengthened over the course of 2 days. After making a second landfall on August 25 near Rockport, Texas, as a Category 4 hurricane, Harvey stalled over the southeastern Texas coast for a number of days, inundating Houston and surrounding areas with the most severe rain event in US history.1
Compared to other hurricanes, Harvey's wind-related losses pale in comparison to its flood-related losses. As flood is typically not a covered peril in private homeowners policies, the large majority of Harvey impacts are expected to be uninsured. Nevertheless, the combination of commercial and automobile flood losses2 will make Harvey a major event for certain segments of the market.
Irma
A prototypical Cape Verde-type storm, Hurricane Irma was the most significant hurricane to strike Florida since at least the 2005 season but will likely be more remembered for what it could potentially have been—the worst insured loss event in history. Up to 1 or 2 days prior to landfall, Irma threatened to pass directly through Miami and up the East Coast of Florida. The consequences of such a hit from a Category 4 or Category 5 hurricane? Potentially well in excess of $100 billion of insured losses, according to various industry sources, more than doubling the impacts of Katrina.3
However, after stalling for a day over Cuba, Irma's path took it away from the major coastal exposure zones of Miami and Tampa and on a path up Florida's spine that mitigated the US loss impacts. While the majority of the Florida peninsula was impacted in some fashion by Irma, the strongest winds were concentrated in southwestern Florida and a series of Caribbean nations, notably the US Virgin Islands, St. Martin, Antigua, and Barbuda. The devastation in those regions was immense, but overall Irma's impacts appear to be manageable for the insurance industry.
Maria
Hurricane Maria was the only one of the three storms to not directly strike the continental United States yet nevertheless might end up causing the most severe impacts. Several factors contributed: Maria made a direct hit on Puerto Rico as a strong Category 4 hurricane, including a direct pass over San Juan, one of the top 25 US metropolitan areas by population.4 Puerto Rico is home to a fairly sizable industrial presence, most notably in the pharmaceutical field. Finally, Maria was perfectly timed to result in "demand surge"—with most available insurance adjusters and supplies already deployed to Texas and Florida, the costs of recovery are likely to be greater for the largely isolated island.
Current Loss Estimates
At this early stage, there is still a wide variety of estimated industry insured losses for each of the three events. In the table below, we provide the latest publicly available figures from three major catastrophe modeling firms.
CURRENT ESTIMATES OF LOSS
| AIR WORLDWIDE | KAREN CLARK | RMS | AVERAGE MIDPOINT | |
| HARVEY | 10–20 | 15 | 18–25 | 17.2 |
| IRMA | 32–50 | 25 | 35–55 | 37.0 |
| MARIA | 40–85 | 29.8 | 15–30 | 38.3 |
Note: All estimates provided in USD billions, exclude National Flood Insurance Program contribution.
All three events appear likely to join Hurricanes Katrina and Sandy in the top five most costly North Atlantic hurricanes on record, measured by either economic or insured losses.5 Combined, the early indications suggest that between $70 billion and $110 billion of losses might be paid out by the insurance industry—more losses than were incurred on every US hurricane from 2006 to 2016 combined.
Key Discussion Topics
What types of alternative capital instruments are most likely to be impacted?
We expect that publicly traded ILS instruments, such as catastrophe bonds, are relatively less likely to be impacted than privately traded instruments such as industry loss warranties (ILWs) and collateralized reinsurance. The primary reason is that privately traded instruments provide funds with more flexibility to write lower in reinsurance towers and obtain quota share exposure to market participants. In a year with several "relatively big" events instead of a single "exceptionally big" one, both of these attributes should be correlated with a higher loss impact.
- Catastrophe Bonds. We expect moderate impacts to the catastrophe bond market, which has already seen several instruments trade at distressed values since HIM, some significantly so.
- ILWs. The ILW market is comprised of two types of instruments: those that cover single major events and those that cover an aggregation of smaller events. Of these, we believe that the ILWs covering aggregation (either in the form of second-event covers or aggregated loss triggers) are the most vulnerable to impacts. We expect that a majority of these types of ILWs will either see loss impacts or at least have their collateral locked in the short term. Several single-event ILWs may also be impacted, although we do not currently expect any of the three events to seriously threaten loss to ILWs with the highest triggers ($50 billion+ of an industry single-event loss).
- Collateralized Reinsurance and Sidecars. Compared to the most recent major catastrophe events (Hurricanes Katrina/Rita/Wilma in 2005, the Japanese earthquake in 2011, and Hurricane Sandy in 2012), the biggest change in today's alternative capital market is the proliferation of collateralized reinsurance and sidecar positions. We believe that these deals, particularly those written in the working layers of reinsurance towers and as retrocessional (retro) covers, will be key contributors of loss. Funds that have written high rate on line layers for Florida specialty homeowners insurers may see the biggest impacts, as well as those that end up with the largest retrocessional exposures, particularly to the Puerto Rican market. Collateralized excess of loss covers are also likely to be the largest contributors to the locked collateral phenomenon (discussed further below).
While it is still too early to accurately estimate the overall ultimate loss for the alternative capital market from HIM, we would not be surprised to see impacts of between 10 percent and 35 percent of net asset value (NAV) for various funds.
How long will it take to have an accurate estimate of losses to alternative capital funds?
One of the key differences between traditional and alternative capital is the reporting timeline. The key reporting periods in the traditional market are quarterly, and there is often a lag of several weeks between the quarter-end and dissemination of results. Many traditional reinsurers were not expected to publicly report their expected HIM impacts until well into October.
By contrast, many alternative capital funds investing in ILS provide official valuations and trading opportunities to their investors on at least a monthly basis. In many cases, funds writing private deals will have to estimate an initial loss position for their investors before their cedents have had the opportunity to determine their own positions. For these initial evaluations, fund estimates are thus highly based on modeled reserves, either from a catastrophe model-based analysis or actuarial-based reserving analysis, or both. Thus, we believe that it is quite reasonable to expect fluctuations in alternative capital fund reserving values over the next few months.
We believe that this will be one of the key operational tests from HIM. Will funds accurately assess their HIM losses in their initial communications to investors, or will their initial estimates prove to be either too high or too low as additional cedent reporting comes in? The answer to this question will depend on how funds have parameterized their central estimates of reserves, as well as any additional risk margins that are held to produce fair value NAVs.
While fund valuation practices do vary across the market, they are already significantly more sophisticated than those used several years ago at the start of the collateralized reinsurance expansion. Thus, while there is no doubt that funds will face operational and claims-handling challenges in excess of anything they have seen before, we believe they should generally have the tools at their disposal to prove their operational resiliency. The task is simply to turn theory into practice.
What are the expected impacts on locked collateral heading toward January 1 renewals?
Locked collateral is the phenomenon that occurs when cedents require their collateralized reinsurers to keep a "buffer margin" of collateral in trust that is in excess of the estimated loss reserves. The margin protects against adverse deviation of the reserve position but delays the fund's ability to redeploy that capital on future deals.
Given the recent rise in collateralized private deals, HIM will be the industry's first major "locked collateral" event(s). We believe that there are several important points to consider regarding this phenomenon.
First, there is both a liquidity element to locked collateral as well as a return drag element. Even if investors are able to successfully reload any locked or "side-pocketed" capital from existing or new investors by the January 1 renewals, the return drag on existing investors may be nontrivial on contracts that see their collateral locked well into 2018 and beyond.
Second, not every position held by managers will be subject to locked collateral. In addition, we fully expect that managers will be able to somewhat mitigate the locked collateral phenomenon by year-end through negotiations with cedents or even by potentially selling out of the positions. It is not yet possible to predict exactly how these negotiations will go. However, the market has exhibited a keen awareness of the potential risk of locked collateral and appears to be proactively working toward solutions.
Overall, the most important financial impact facing funds today is the HIM losses themselves. Locked collateral will play a secondary role but one that is worthy of further discussion at another time.
Will this season finally lead to market hardening?
HIM has dominated both the insurance and national news for more than a month. As such, we expect to see some amount of rate increases at January 1 and beyond. While ranges vary, there are already indications that double-digit percentage rate increases may be expected in some markets, with the largest increases reserved for retro deals and loss-impacted positions.6 We agree that the broader trend will be upward but offer the following two considerations regarding the magnitude of the impacts.
- New capital arises? Given the turnover of capital, brokers and funds are forced into a bit of a chicken-and-egg game at the January 1 renewals. On one hand, it may be difficult to estimate the necessary rate changes without an idea of how much new capital may enter the market. On the other hand, potential investors will be more willing to deploy significant capital if they know a larger rate change is in store. After previous loss-heavy years (1992, 2001, and 2005), new sets of start-up reinsurers came to market. Will the same thing happen this year, or will we instead see capital flowing to existing players and funds?
- Time for model review? AIR, RMS, and other catastrophe modelers have provided some of the most important "early indications" of HIM loss to an information-hungry market. However, as shown above, the storms have also highlighted the enormous uncertainty in modeled estimates—particularly for Maria, where the AIR and RMS ranges are nonoverlapping, and the Karen Clark estimate nearly sits in between the two. As was seen post-2005, major events pose an opportunity for reviews of model performance and in some scenarios have even led to relatively sizable model revisions. If HIM leads the market to reassess some of its assumptions regarding modeled output, it could contribute to interesting renewal negotiations throughout 2018 and beyond.
Conclusion
Harvey, Irma, and Maria will cause widespread impacts across the reinsurance industry. The alternative capital market will share broadly in these losses, leading to what is likely to be the first year in the market's history that it will deliver a sizable negative return to its investors. While this will pose various operational challenges to participants, it also gives alternative capital funds a chance to develop a reputation as reliable counterparties that pay losses efficiently and are committed to reinsurance for the long term. In time, we are likely to view HIM as the beginning of a new chapter for the alternative capital market.
- Jason Samenow, "60 inches of rain fell from Hurricane Harvey in Texas, shattering U.S. storm record," Washington Post (September 22, 2017). (Retrieved October 26, 2017.)
- Jonathan Smoke, "Hurricane Harvey: The worst disaster for automobiles ever," The Hill (September 6, 2017). (Retrieved October 26, 2017.) Harvey may end up being the single largest auto insurance loss event in history.
- E.g., Lloyd's of London, AIR, and Karen Clark Company, as reported in "Lloyd's RDS: $131bn insured loss from Miami windstorm," Trading Risk (September 8, 2017). See also "Irma's track a key factor in insurance impact," Trading Risk (September 6, 2017). (Both accessed November 15, 2017.)
- As of the 2010 Census.
- This would require all three storms to have economic losses greater than $37.5 billion (Ike, 2008) and insured losses greater than $15.5 billion (Andrew, 1992). All dollar values nominal. Insured loss figures via Insurance Information Institute, "Facts + Statistics: Hurricanes."
- Industry sources include "Retro rates expected to rise +25% at 1/1" (Trading Risk, October 18, 2017), "S&P: 1.1 reinsurance rates flat to up 5%" (Trading Risk, October 16, 2017), and "Hannover Re expects broad reinsurance price rise to 2015 levels" (Artemis, October 19, 2017).
Aaron Koch | November 15, 2017


